Claude Dashboards & Motion
Build live dashboards and animate explainers with Claude
Claude's beta artifacts that turn natural-language questions into live data dashboards and code-built animated explainers.
Claude homepage
1 / 3Overview
What is Claude Dashboards & Motion?
Build live dashboards and animate explainers with Claude
Claude Dashboards and Claude Motion are two beta artifacts in Claude that turn questions and reports into living visuals.
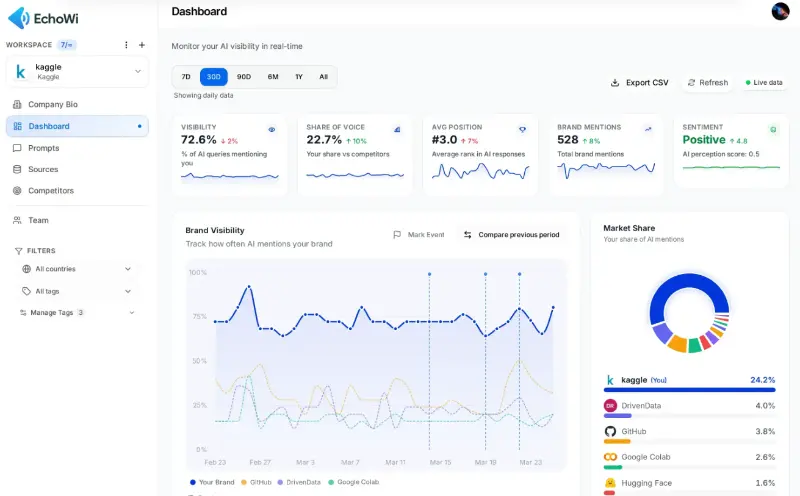
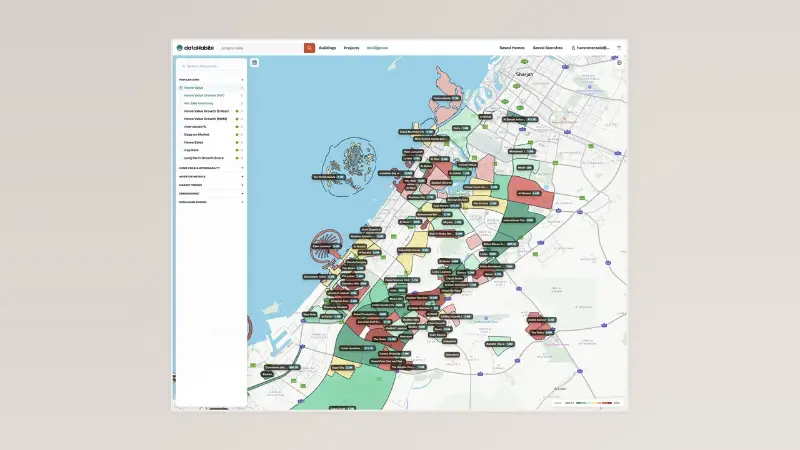
Dashboards connects BigQuery, Databricks, Snowflake, Redshift, ClickHouse, or Salesforce and turns natural-language questions into dashboards that refresh as your data changes. Every number shows the query behind it — click any figure to inspect it or have Claude explain the logic, and see when the data was last refreshed.
Motion turns reports, charts, and product explainers into code-built animations (no video generation models): edit any text, number, or timing in the editor, then download as MP4. Dashboards can be sent to Amplitude, Grafana, Hex, Mixpanel, and more; animations move into Adobe, Descript, HeyGen, Runway, and Luma AI.
Dashboards requires a Claude paid plan and Motion requires Team or Enterprise; both are in beta. Enterprise controls include CMEK, admin-managed artifact templates, and team collaboration on the same document or dashboard, and artifacts can be shared outside the org.
Platforms and languages
Claude Dashboards & Motion Availability
Platforms
Languages
Capabilities
Claude Dashboards & Motion Key Features
Claude Dashboards
Connects BigQuery, Databricks, Snowflake, Redshift, ClickHouse, or Salesforce and turns natural-language questions into dashboards that refresh as data changes.
Transparent queries
Every chart reveals the query behind it: click any number to inspect or have Claude explain the logic, with the last data refresh time shown.
Claude Motion
Turns reports, charts, and explainers into code-built animations — edit any text, number, or timing in the editor, then download as MP4.
Two-way integrations
Dashboards send to Amplitude, Grafana, Hex, Mixpanel, and more; animations move into Adobe, Descript, HeyGen, Runway, and Luma AI.
Enterprise collaboration
Artifacts support CMEK, admin-managed templates, team collaboration on the same document, and sharing outside the organization.
Best for
Who uses Claude Dashboards & Motion?
Business and data teams
Ask questions in natural language and get live dashboards over company data
Presenters and content creators
Turn reports and charts into editable animated explainers for talks and videos
Enterprise customers
Collaborate on dashboards and documents with centralized security controls
Plans and access
Claude Dashboards & Motion Pricing
Freemium
Free $0, Pro $20/mo; Dashboards needs a paid plan, Motion needs Team/Enterprise (both beta)
Common questions
Claude Dashboards & Motion FAQs
What are Claude Dashboards and Motion?
Two beta artifacts inside Claude: Dashboards turns natural-language questions into live dashboards connected to your data sources; Motion turns reports and charts into code-built animated explainers you can export as MP4.
Which plans include Dashboards and Motion?
Dashboards is available on paid plans, and Motion is available on Team and Enterprise. Both are currently in beta.
Which data sources can Dashboards connect to?
BigQuery, Databricks, Snowflake, Redshift, ClickHouse, and Salesforce. Dashboards can also be sent to tools like Amplitude, Grafana, Hex, and Mixpanel.
How is Motion different from AI video generators?
Motion builds animations frame by frame from code rather than using a video generation model, so any text, number, or timing is editable in the editor before you export.
What enterprise and data controls are available?
Enterprise controls include CMEK encryption, admin-managed artifact templates, SSO, and optional training opt-out; teams can collaborate on the same document or dashboard.
Reviews
See what the community thinks and share your experience.
—
Based on 0 ratings
Rating distribution
Community reviews
No reviews
No written reviews yet.