An observability platform that traces every model and tool call in an AI agent run, with tokens, cost, latency and errors in one view.
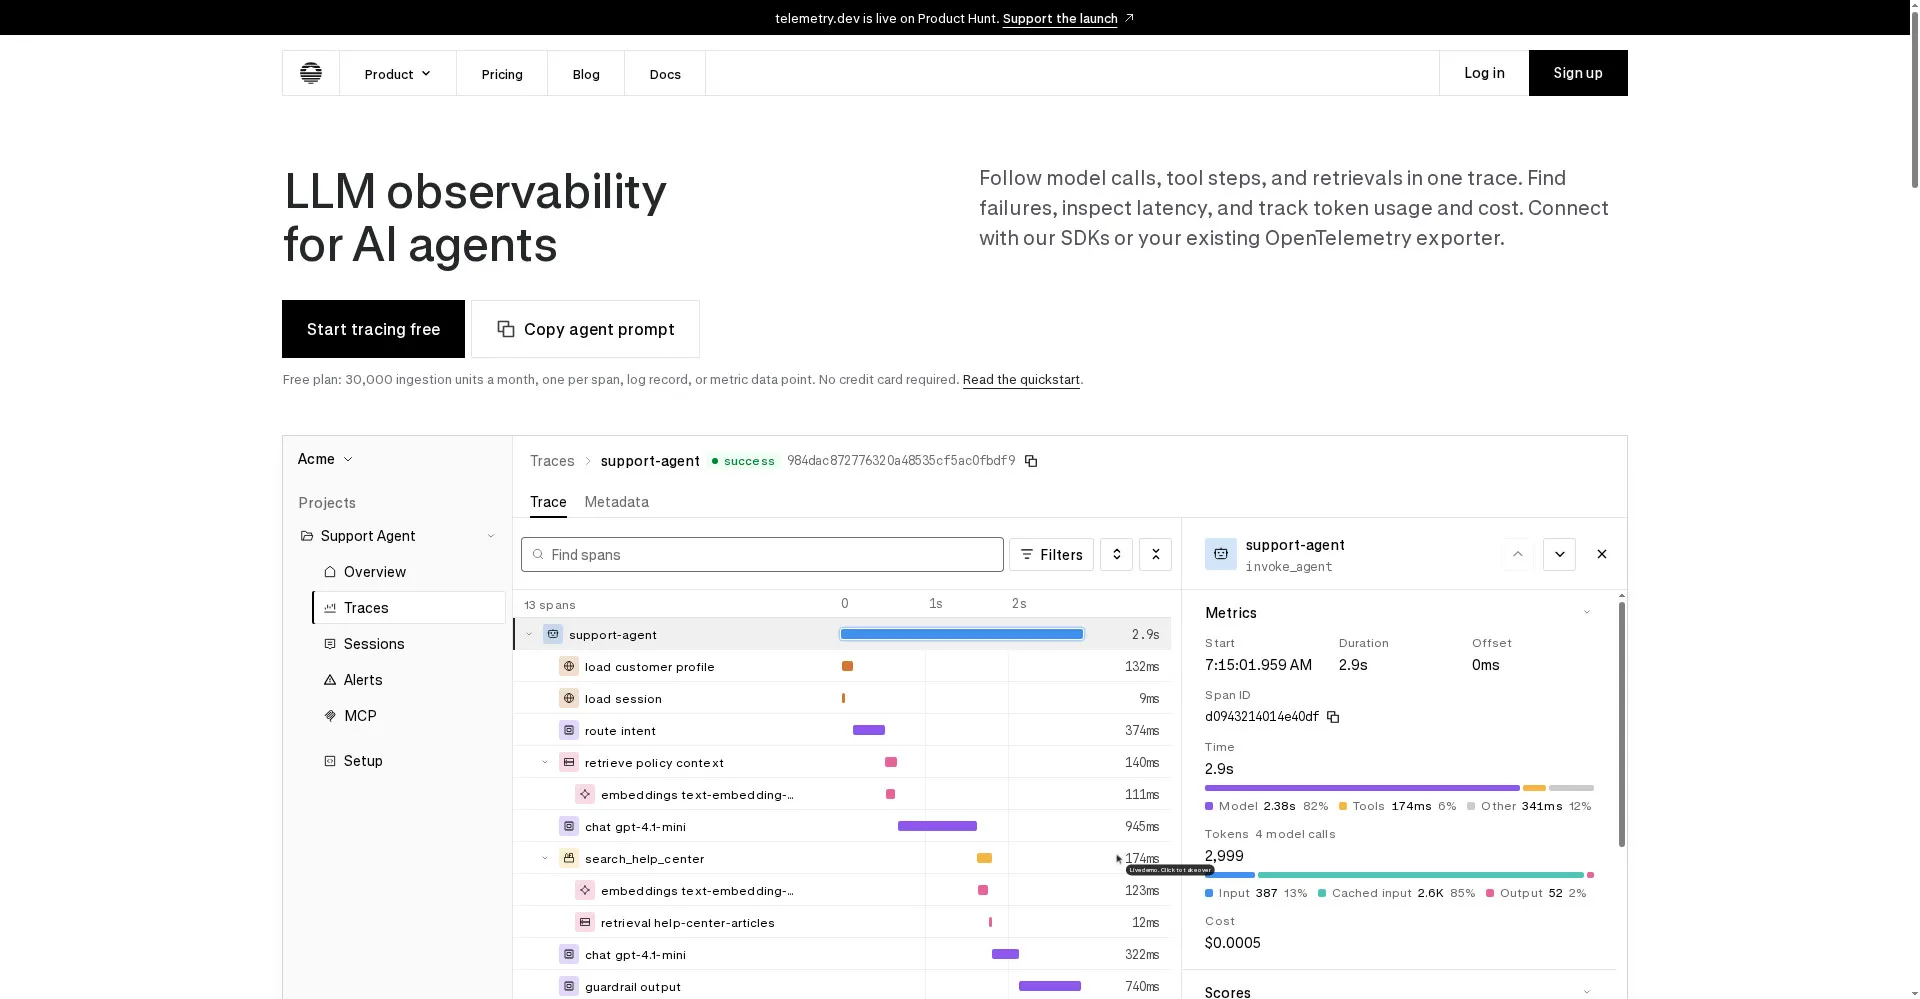
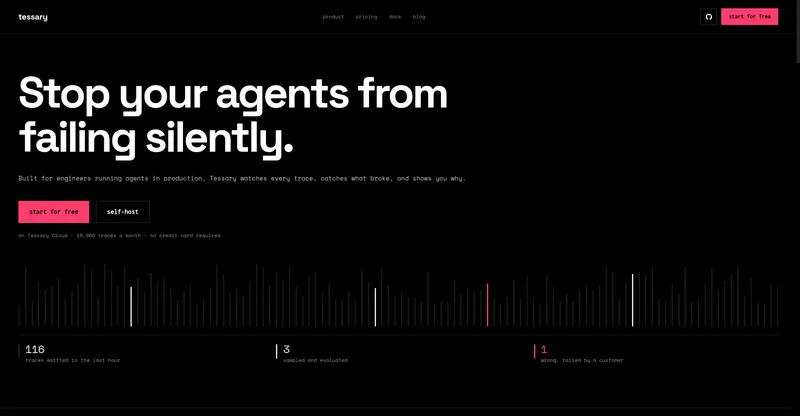
telemetry.dev homepage with trace view
1 / 2Overview
What is telemetry.dev?
LLM observability for AI agents
telemetry.dev is an observability platform for AI agents, built on OpenTelemetry. When an agent breaks in production, it shows each run as one trace, with every model call and tool call as a span carrying its duration, tokens, cost and error, so you can find the slow step or the failed call.
Prompts and evals use the same traces: change a prompt without a deploy, then run it on a dataset and compare scores with production. Alerts flag errors piling up, cost spikes and agent loops. Connect with TypeScript or Python SDKs for OpenAI, Anthropic, the Vercel AI SDK, LangChain and more, or with the OpenTelemetry exporter you already use. The free plan needs no credit card, and a read-only MCP server lets your coding agent investigate traces for you.
Platforms and languages
telemetry.dev Availability
Platforms
Languages
Capabilities
telemetry.dev Key Features
One trace per agent run
Every model call, tool call and retrieval becomes a span with duration, tokens, cost and error.
Cost and latency in view
Compare spend, latency and errors by model, provider and environment.
Prompts without redeploys
Change prompts without a deploy, then test a new version on a dataset before it goes live.
Alerts before users notice
Email alerts for cost spikes, budgets, agent loops and model or tool errors.
MCP and CLI access
A read-only MCP server and a CLI let your coding agent read traces and investigate failures.
Best for
Who uses telemetry.dev?
Developers and teams running AI agents in production
Find which step broke a run, what it cost, and where time went
Plans and access
telemetry.dev Pricing
Freemium
Free: 30,000 ingestion units a month, no card; Pro $25/month; Team $50/month, per workspace
Common questions
telemetry.dev FAQs
What does telemetry.dev show me?
Each agent run as one trace, with every model and tool call as a span showing duration, tokens, cost and error.
How do I start sending traces?
Make a project API key, add the SDK or OTLP exporter for your stack, run an instrumented request, then open its trace in your project.
Is the free plan really free?
Yes, with no credit card: 30,000 ingestion units a month, 14-day retention, one project and two seats.
Can I keep prompts out of storage?
Yes, capture can be disabled per environment before storage for recognized prompt, response and tool-payload fields.
Which frameworks are supported?
TypeScript and Python have first-party SDKs, with integrations for OpenAI, Anthropic, Vercel AI SDK and LangChain; other languages can send standard OTLP over HTTP.
Reviews
See what the community thinks and share your experience.
—
Based on 0 ratings
Rating distribution
Community reviews
No reviews
No written reviews yet.